Desk tape · Sep 1 cash close
XLV still leads. Friday’s map still stands.
 CosAnalyst
research desk
CosAnalyst
research desk
We sat Tuesday’s cash. XLK, XLY, and XLI paid; XLE, XLU, and the leader XLV bid. That is a session, not a new weekly map. Health Care is still 95, Financials 87, Energy 87 HOLD. We re-rank Friday if oil sticks.
As of Tuesday 1 Sep 2026, US cash close 4:00 p.m. ET. A CosAnalyst Research Project. SIMULATED RESEARCH / BOOK FACT • NOT A TICKET. Publisher + AI-assisted. Not advice.
1. The Friday map is still the map
Rank and score are Friday 28 Aug 2026 close. Same published map. We do not invent a midweek score.
The Sector Selector Score is a rules-based 0–100 measure of sector leadership. It compares each major U.S. sector with the broad market and evaluates relative strength, trend health, and price location. Higher scores indicate stronger confirmed leadership; lower scores indicate lagging or weakening conditions. The model is recalculated after Friday’s close, while weekday updates explain changes without rewriting the weekly map.
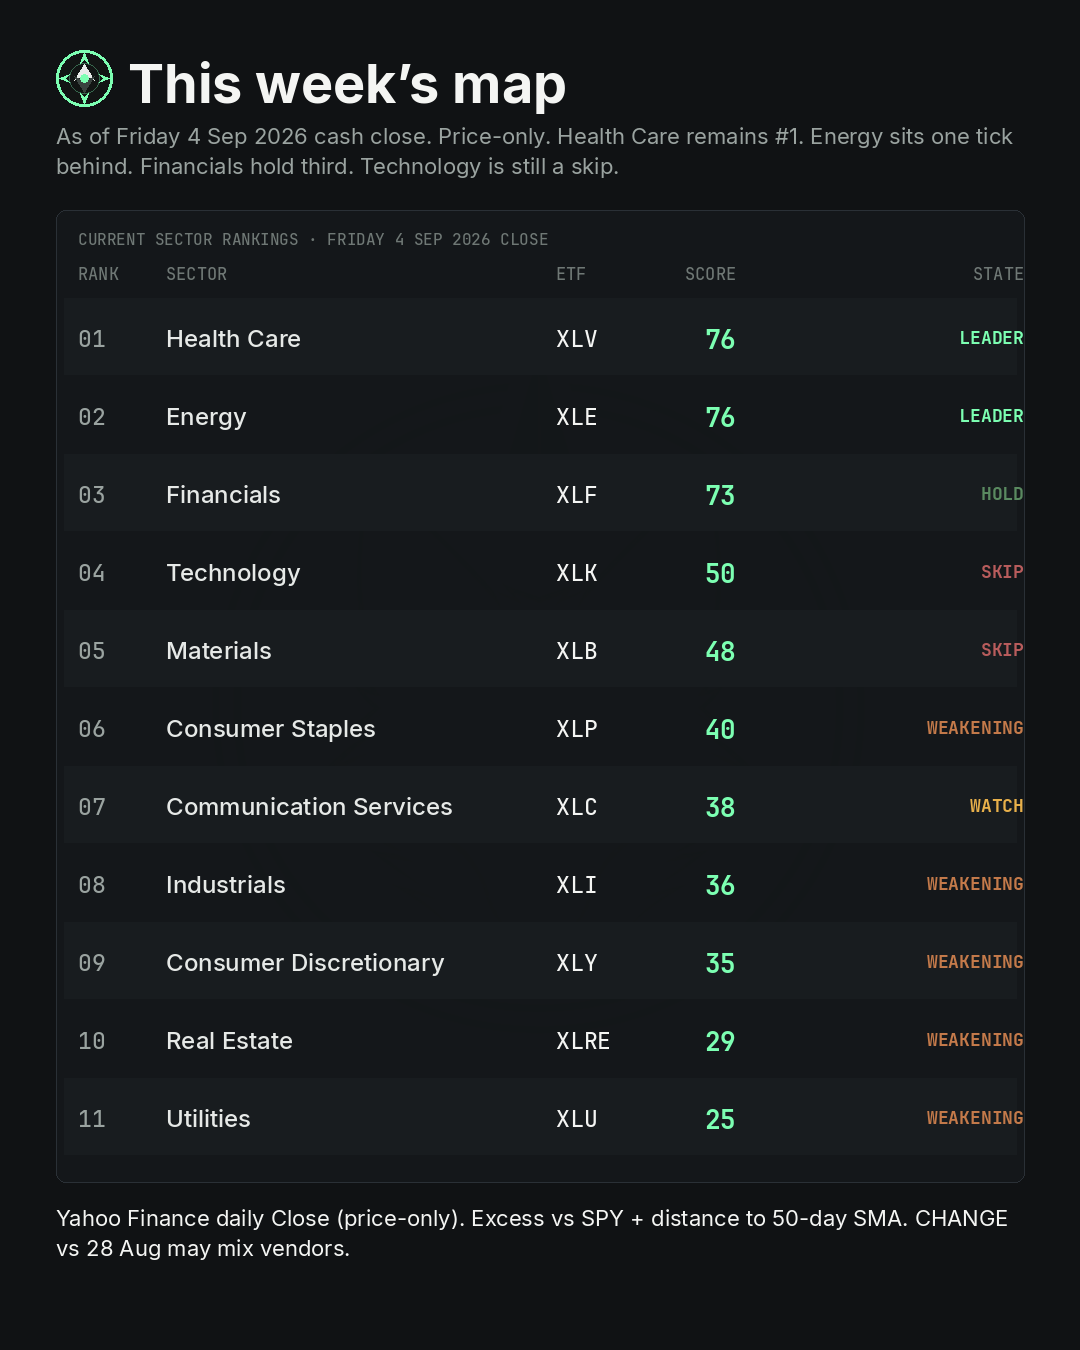
| CURRENT SECTOR RANKINGS · Friday 28 Aug 2026 close | ||||
|---|---|---|---|---|
| Rank | Sector | ETF | Score | State |
| 01 | Health Care | XLV | 95 | LEADER |
| 02 | Financials | XLF | 87 | LEADER |
| 03 | Energy | XLE | 87 | HOLD |
| 04 | Materials | XLB | 59 | SKIP |
| 05 | Consumer Staples | XLP | 56 | NEUTRAL |
| 06 | Industrials | XLI | 50 | WEAKENING |
| 07 | Real Estate | XLRE | 49 | WEAKENING |
| 08 | Communication Services | XLC | 39 | WATCH |
| 09 | Technology | XLK | 36 | SKIP |
| 10 | Consumer Discretionary | XLY | 35 | WEAKENING |
| 11 | Utilities | XLU | 31 | WEAKENING |
XLP and XLY: the location input was unavailable that week. We did not invent it. Energy is HOLD — not a new ticket.
A Tuesday session does not rewrite a Friday-close rank. The map on sectorselector.ai is still Friday’s map.
2. Tuesday cash
Tuesday 1 Sep 2026 cash % vs Monday 31 Aug close. Last is the Tuesday cash print. The day is the day, not a new score.
| Tuesday 1 Sep cash % · vs Mon 31 Aug close | ||||
|---|---|---|---|---|
| Sector | ETF | Last | Cash % | Tape |
| Technology | XLK | 183.64 | −1.53% | down |
| Consumer Discretionary | XLY | 114.59 | −1.72% | down |
| Industrials | XLI | 172.73 | −1.37% | down |
| Materials | XLB | 52.07 | −1.18% | — |
| Financials | XLF | 57.20 | −0.88% | — |
| Communication Services | XLC | 110.88 | −0.52% | — |
| Real Estate | XLRE | 44.04 | −0.16% | — |
| Consumer Staples | XLP | 85.25 | +0.32% | — |
| Health Care | XLV | 171.67 | +0.66% | up |
| Utilities | XLU | 42.56 | +0.78% | up |
| Energy | XLE | 64.77 | +1.27% | up |
XLE cash last 64.77 — through 64.70, the high Cos named on this adjusted tape. Index location: QQQ 707.64 / SPY 761.78.
Tuesday’s cash moved XLK / XLY / XLI lower and XLE, XLU, and the leader XLV higher. Energy through 64.70 is Tuesday’s tape. We re-rank Friday if oil sticks. $WTI is the oil cashtag on this desk. Weekday tape does not rewrite the weekly map.
3. Week ahead
Times ET.
- Wed Sep 2 8:15 — ADP
- Wed Sep 2 10:30 — EIA ($WTI) · CONFIRMED
- Wed Sep 2 2:00 — Beige Book
- Thu 8:30 — Waller
- Fri 8:30 — NFP
4. Index location
Cash close · Tue 1 Sep 2026 · 4:00 p.m. ET
- QQQ
- 707.64
- SPY
- 761.78
Sep 2 1DTE box 701.55–713.15, magnet 700 / invalidation 717, as-of 1:13 PT.
Book fact · not a ticket.
This note is simulated research from a publisher and an AI-assisted research desk. It is not advice and not a ticket. The map is Friday-close only. We do not invent a score. Oil is $WTI.